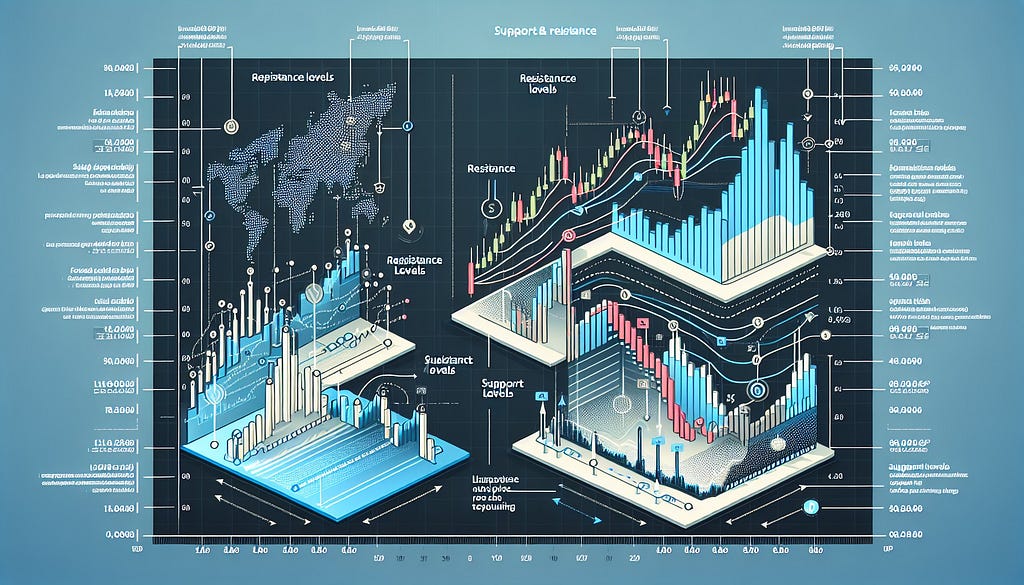
Understanding Support and Resistance Levels in Trading
Support and resistance levels are fundamental concepts in trading, crucial for anyone looking to improve their market strategies. These levels help traders predict price movements and strategically plan their entries and exits in the market.
What Are Support and Resistance Levels?
Defining Support Levels
Support levels represent price points where demand is strong enough to stop a stock from falling further. This indicates a concentration of buyers creating a "floor" for the asset.
Define Resistance Levels
Resistance levels are where supply is strong enough to prevent a stock from moving higher, indicating a concentration of sellers. These act as a "ceiling" for prices.
The Importance of Support and Resistance Levels
Strong support and resistance levels are characterized by more historical touches and increased trading volume. When these levels are broken, they often reverse roles, with support becoming resistance and vice versa.
Types of Support and Resistance Levels
Static Support and Resistance Levels
Static levels remain unchanged regardless of future trading activity. They are identified through previous highs and lows or significant key price levels.
Dynamic Support and Resistance Levels
Dynamic levels change based on updated data, often influenced by moving averages and trendlines.
Psychological Support and Resistance Levels
These levels form around round numbers where traders psychologically perceive significant price decisions.
How to Identify Support and Resistance Levels in Binary Options Trading
Using Price Action to Identify Support and Resistance
Price action involves observing how an asset's price moves over time to spot bounce patterns near support or resistance levels.
Leveraging Technical Indicators for Support and Resistance
- Moving Averages as Dynamic Support and Resistance: Moving averages act as dynamic indicators that guide price trends over specific periods.
- Using RSI to Identify Overbought and Oversold Conditions: The Relative Strength Index (RSI) helps indicate whether an asset is potentially overbought or oversold, informing possible resistance or support encounters.
Drawing Trendlines to Identify Support and Resistance
Trendlines are visual tools connecting series of higher lows or lower highs to map the asset's direction, aiding in predicting support or resistance levels.
Trading Strategies Using Support and Resistance Levels
The Bounce Strategy
The bounce strategy involves placing trades when the price hits a support or resistance level and bounces back in the opposite direction.
The Breakout Strategy
This strategy focuses on trading when prices break through established support or resistance levels, indicating strong momentum.
Combining Indicators for Better Accuracy
Enhance trading strategies by combining support and resistance analysis with other technical tools like moving averages, RSI, or Fibonacci retracement levels for more comprehensive market insights.
Conclusion
Support and resistance levels provide valuable insights into market behavior, enabling traders to make informed decisions. By understanding and leveraging these levels along with other technical indicators, you can improve your binary options trading strategies substantially. Explore here for free trading strategies and subscribe to our YouTube Channel for practical live trading sessions.
Super Beitrag! Bei GRMNIPTV habe ich eine stabile und benutzerfreundliche IPTV-Lösung für Zuhause gefunden.
AntwortenLöschen